You are here: Home ~ Web UIs ~ Using Sound and Graphics in Applications
Using Sounds and Graphics in Applications
This page contains background material provided to the
attendees of a 2004 UPA workshop called "Yeah, I hear you: Why aren’t there more
sounds and graphics in our applications?" It includes descriptions and definitions of visual and
aural terms as well as a bibliography.
Some of these materials were later turned into a training handout. Click here for a copy of the Real Rules (in Word), which is a one-page distillation of what we think is true about using sounds and graphics in interfaces.
--Alice Preston, Susan Fowler
Aspects of Visuals
The principles of design are:
Harmony: In unison. Anything that is closely allied
and not alien to its other parts is in harmony.
Balance: The center of gravity.
Rhythm: An expected recurrence.
There are multiple types of balance:
Symmetrical balance: A mirror image on either
side of an axis or axes. It lacks variety but is useful for decorative patterns
or formal compositions.
Radial balance: Rotation around a central point. It
always has movement (unlike symmetrical balance, which is static). Radial
balance is chiefly used in decorative patterns or architectural plans.
Occult balance: No central core. It uses opposing elements;
there are no rules. Using occult balance well is a matter of sensitive judgment.
It is the most difficult since it gives greater freedom but demands greater
control of sizes and shapes.
There are multiple types of rhythm as well:
Radiation: Lines leading out from a center axis.
Repetition: A pattern that is repeated.
Progression: Repeated movement.
Alternation: To change direction, or to perform by turns.
Transition: A change from one pattern to another.
Note that “harmony” and “rhythm”
are musical terms used metaphorically when applied to visuals. Visuals and sounds
are very different modalities: Visuals show relationships in space; sounds describe
relationships in time. (Animation, which is not addressed in the workshop, shows
both space and time.)
Additional terms used to describe visuals, or the effects
that visuals create in the observer, include:
Contrast: A difference of form, color, dimension, or
shape.
Dominance: An outstanding feature in a design, usually
the result of size or color.
Subordination: The use of a smaller feature, color, or
pattern in relation to other areas.
Open form: An opening through which you can see space.
Closure (or closed form): Lines or planes that enclose
an open area.
Opposition: When differences occur—for example,
soft and hard edges or explosive vs. calm.
Tension: An unresolved visual relationship between objects
in a painting. The eye jumps back and forth between them without settling
on a single point.
Variety: Some dissimilarity between objects that creates
interest.
Units of Expression
The units of expression in design are:
Line
Area (the second dimension)
Volume (the third dimension)
Color
Texture
If line, area, volume, color, and texture are simply thrown
together at random, they produce disorder and chaos. If they are organized and
governed by the laws of harmony, balance, and rhythm, they become a design.
Dimensions
Lines may be delicate or bold, angular or curved and flowing.
They may be outlines; integral parts of the form that they describe and appearing
only as the edges of areas; or free-flowing movements independent of a solid
form.
Area is surface. Two dimensions provide breadth. Tones may
be spread over a surface, not limited to one dimension. Area is bounded by contour
or shape.
Volume (or three dimensions) is mass occupying space. It
implies solid form and void (void, containing nothing, empty).
Color
Color is the quality of visible light reflected by a tone.
A color has hue (which is the particular color reflected), value (which is lightness
and darkness), and intensity (which is saturation of hue).
To avoid monotony in color schemes, it is necessary to choose
some warm colors and some cool colors.
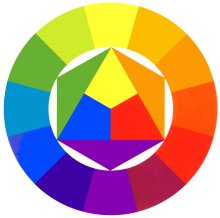
Complementary colors (the colors opposite each other on
the wheel) provide the greatest hue contrast. The same amount of each color
should not be used; one or more should dominate.
Harmony can be achieved by a similarity of value, by a common
neutrality or grayness, or by a common color.
Colors can be used to express a mood. They may be very gay
and bright or very subdued and quiet. They may be strong and blatant or delicate
and pastel.
Texture
Texture is the visual or tactile quality of a surface. The
visual aspect of a surface is that which we see, while the tactile aspect of
a surface is that which we feel (actually, as when we touch the surfaces of
sculptures or canvases with thick surfaces of paint, or metaphorically, because
we know what an item shown in a painting feels like).
Shiny materials contrast with those that are dull. The cold
of glass and metal differs tactilely from the warmth of wood.
Opacity, translucence, and transparency are visual aspects
of texture. We cannot see through opaque surfaces; we can see into but not through
translucent surfaces; and we can see through transparent materials.
Aspects of Sound
Depending on whose book you read, sound is made up of several
basic aspects:
Pitch–measured in Hertz (Hz), or vibrations per
second. In music, pitches are given names and at least relatively standard
settings. For example in North America, the standard for concert A is 440
Hertz. Orchestras tune to this pitch, the telephone dial tone is tuned to
this pitch, etc. In Europe, however, the standard for concert A varies from
442-446 Hertz.
Duration–measured in beats per minute, in music,
using a tool called a metronome. Western musicians have a very specific system
codifying how to notate beats and divisions of beats, though the system has
changed significantly over the last 200 years, and is not in common use in
many parts of world. Terminology for this system, however, varies greatly
between Europe and North America.
Timbre–a rather subjective term, referring to the
way a particular tone sounds. Imagine, for example, the difference between
an electronic bell, a large church bell such as Big Ben, and the sound of
a doorbell or a Chinese gong (or Tam Tam). Or the difference between Bob Dylan's
voice and the voice of Luciano Pavarotti in his heyday. Or the difference
between a flute and a cello. Sometimes called tone.
Volume–the loudness of the sound, which can be
measured in decibels or bels.
With these four aspects or attributes, it is possible to
describe a sound (or in musical terms, a “note”) with some likelihood
that another person of your culture would understand what you're describing,
be able to identify it, and perhaps be able to reproduce it.
However, accurate pitch recognition and duplication is rare
within most populations (this is called “perfect pitch,” and there
is some disagreement about whether or not it can be learned). Even among trained
musicians, good relative pitch is much more common than perfect pitch. In constructing
or choosing sounds for applications, it's important to remember that, since
your users will likely not be able to tell the difference between two sounds
based on the difference of pitch alone.
There are many additional definitions that might be of use
during the construction and selection of sounds for applications. This is not
meant to be an exhaustive list, and the definitions are pretty basic. The bibliography
includes links to good dictionaries that specialize in these terms.
Frequency–basically the same as pitch, however
the sound with any interest to it at all is made up of a fundamental (lowest)
frequency and a set of overtones or harmonics. Pythagoras spent quite a lot
of time studying the overtones series, and identified certain mathematical
facts, which have not changed in the intervening time.
Interval–the distance between two pitches. The
distance from the lower note is spoken of as a second, third, fourth, etc.,
up to an octave, which vibrates approximately twice as fast as the starting
note.
Attack–the way a sound starts. This contributes
to its timbre, and is largely made up of more or less white noise on examination
of sound waves. In music, there are many types of attacks, including staccato
(detached), legato (smooth and connected), portamento (between the two), pizzicato
(plucked, as on a violin string), and others. Musicians have a whole set of
different ways to start sounds, and they are very dependent on the instrument
being played. The way a sound ends also has a name (decay) but it is not used
much in music.
Consonance–when two or more sounds (notes) sound
good together. As you might imagine, this is culturally predetermined, and
has very tremendously over the history of even Western music. Contrast with
dissonance, which is used to describe when two sounds do not sound good together.
Aspects of Music
When you put together a number of sounds or notes and make
music from them, there are some other definitions that become important. Here
are the most important of those. (Warning: this is murky stuff, and it's pretty
difficult to define any one of these in isolation from the others.)
Melody–a succession of notes that form a distinctive
sequence. In older dictionaries, it says “A sweet or agreeable succession
of sounds.” A motif is a little piece of melody used by a composer to
build a larger composition. Gregorian chant consists only of melody, and later
a second melody line was added; when the music consists of all melody lines,
this is called polyphony.
Harmony–the accompanying parts, often including
chords, that underlies the melody. The same dictionary says, “Note:
Melody consists in a succession of single tones; harmony is a consonance or
agreement of tones, also a succession of consonant musical combinations or
chords.” Of course, harmony need not always be underneath the melody,
the melody could be in the middle somewhere.
Rhythm–the movement of melody and harmony in time.
Or “Movement in musical time, with periodical recurrence of accent;
the measured beat or pulse which marks the character and expression of the
music; symmetry of movement and accent” –Moore.
Tempo–the speed of the music. For example, the
same piece of music could be played fast and seem a very happy, bouncy sort
of thing, or it could be played very slowly and seem like a dirge, without
any other change to its melody, harmony or rhythm.
The online Grove’s Dictionary (http://www.grovemusic.com),
which is a subscription service, contains 45,000 articles on aspects of music,
musicianship, and musicians. This very brief introduction necessarily leaves
a whole lot out.
Sounds and Music in Use
Other than background music that is used in gaming, most
current research into the use of sounds to assist with transfer of information
concentrates on audio icons and earcons. The earliest citation of the word “earcon”
seems to be from The Guardian in 1988 (http://www.wordspy.com/words/earcon.asp),
though the research papers we've seen from ten years later are all talking about
audio icons.
In either case, the whole idea is to be multimodal. That
means that you supply both a visual clue and, in this case, a sound clue to
the purpose of the interaction that you're enabling. It seems that people have
tried realistic sounds for the picture on the icons, for example. And they've
tried to use small musical motifs (or motives), and there's been a fair amount
of research done on how people deal with those.
For example, just as most people cannot remember absolute
pitches, they also cannot distinguish among motives that are too similar or
too many sound clues that happen all the same time. However, there is interesting
psychological research on how people filter out unnecessary sounds in social
situations. There doesn’t seem to be much research yet on multiple sounds
in applications, probably because there are not too many applications out there
with that problem yet.
Auditory Icons vs. Earcons
Starting about 1999 or so, the research began to clearly
differentiate between auditory icons and earcons. So what is the difference
between the two? Here’s a citation in a student paper from Columbia written
last year:
With auditory icons, realistic or abstract sounds are
mapped to events and interactions with entities in the interface. Auditory
icons are recognizable sounds learned though experience and are used to identify
the source of the sound. They can be used as direct representations of entity
properties, but also as abstract or semi-abstract mappings. Earcons are generally
not natural sounds, built from simple components – motives, and used
to build structured sets of sounds (e.g. hierarchies) that are mapped to a
particular aspect of the UI. The main problems with these two types of acoustic
icons are recall, memorability over time, and the maximum perceivable sequence
of auditory icons or of compound ear-cons. Furthermore, using a large number
of auditory icons or using them out of context could bring similar problems
[4].
REFERENCES
1. Peek, Philip, “Re-Sounding Silences”. In
Kruth, P. and Stobart, H., (Editors), Sound, Cambridge University Press, 2000.
2. Gaver, W. “The SonicFinder: An interface that
uses auditory icons”. Human Computer Interaction, 4(1), 67-94, 1989.
3. Brewster, S.A., Wright, P.C. & Edwards, A.D.N.
“Experimentally derived guidelines for the creation of earcons”.
In Adjunct Proceedings of HCI'95, Huddersfield, UK, 1995.
4. Mynatt, E. Mynat. “Designing with Auditory Icons:
How Well Do We Identify Auditory Cues?” In Proceedings of CHI'94, 1994.
From Use of Sounds in Specialized User Interfaces: Group
Modulation, Angel Janevski, Columbia University Computer Science Department,
2003.
Relationship of Art and Music to Software
Design
First, keep in mind that application design, even web page
design, is impoverished compared to fine art and music, and that is as it should
be.
Art and music are complicated. Modern artists and musicians
play with and experiment with the elements described above, combining or isolating
them to see whether they gain or lose meaning. For example, minimalist Donald
Judd used stacks of Plexiglas and metal boxes to show the box-ness of boxes.
Musician Phillip Glass uses repeated tones, alone, to create walls of music.
Good software design, however, uses the elements described
above in support of information, not as ideas to manipulate for their own sakes.
Color and line are restricted so that only the changes are noticeable; negative
and positive space are used to separate the unimportant from the significant;
sounds are used to get the user’s attention.
When window designs, sounds, and visualizations go bad,
the reason is often a confusion or misunderstanding of the design elements.
In general, software designers need to create harmonic, balanced, and rhythmic
backgrounds against which alarms and anomalies can emerge as “broken”
elements.
Second, we users are often more different than alike in
our ways of taking in information. Learning style and multiple intelligences
theories suggest that some people learn orally, others visually, others using
written materials, and others kinesthetically. Our current interfaces, however,
predominantly use read-write interactions.
Finally, multi-sensory systems support fast, accurate
reflexive action when needed. They can bypass the conscious mind and allow people
to react instantaneously when necessary and to solve “insight problems”—tasks
that are perceptual, complex, and nonverbal.
Where to Go from Here
The attached bibliography contains four kinds of information:
General sites that have information about sound, music,
or visuals.
Some research papers on topics that might be interesting
to attendees at this workshop.
Some resources having to do with the particular problems
and solutions for those with limited visual acuity of various kinds.
Development packages for visuals.
Some of the papers will require you to know how to read
musical notation or to deal with graphics that illustrate the differences in
related sounds. (These graphics are usually derived from the way sounds look
on oscilloscopes or similar hardware.)
Final note from Alice Preston: Because of overuse in my
hands and shoulders, I dictated my part of this paper with ScanSoft’s
Dragon NaturallySpeaking voice-recognition software. For that reason, and although
I try to proofread carefully, there may be occasional misrepresentations of
what I said. As our systems accommodate people of varying capabilities and add
modes to the communications between computers (or other kinds of machines) and
people, we will need to build in tolerance for these kinds of approximations.
Comparisonics Corporation. “FindSounds: Search the
Web for Sounds.” 2004. http://www.findsounds.com/ (6 April 2004). A free
site where you can search the Web for sound effects and musical instrument samples
Department of Psychology, McGill University. “Home
Page of the Auditory Research Laboratory.” April 1996. http://www.psych.mcgill.ca/labs/auditory/laboratory.html (6 April 2004). McGill University Auditory Research Lab, where they’re
studying how humans filter out unimportant sounds; they call this Auditory Scene
Analysis.
Glasgow Multimodal Interaction Group. “Welcome to
the Earcons and Multimodal Interaction Group Home Page!” March 8, 2004.
http://www.dcs.gla.ac.uk/~stephen/ (6 April 2004). A site summarizing the research
into multimodal human-computer interaction and in the use of non-speech sounds
to improve computer-human interaction. http://www.dcs.gla.ac.uk/~stephen/earconexperiment1/earcon_expts_1.shtml describes some of their earcon experiments.
ICAD. “International Community for Auditory Display.”
Oct. 26, 2003. http://www.icad.org/ (6 April 2004). A forum on using sound to
display data, monitor systems, and provide enhanced user interfaces for computers
and virtual reality systems.
Shapiro, Kivi. “Graphics and Sound File Formats.”
January 31, 1996. http://www.nlc-bnc.ca/9/1/p1-223-e.html (6 April 2004). Definitions
of graphics and sound file formats from National Library of Canada.
Oxford University Press. “Grove Music Online.”
2003. http://www.grovemusic.com (6 April 2004). A subscription service for the
long-standing “king" of all music dictionaries. Updated annually.
Sound and Video Analysis and Instruction Laboratory. “Glossary.”
September 11, 2003. http://www.indiana.edu/~savail/workingpapers/glossary.html (6 April 2004). Some basic definitions of aspects of sounds in musical and non-musical
terminology.
TechCorps. “webTeacher: Sound Files.” June 27,
2002. http://www.webteacher.org/winexp/sounds/sounds.html (6 April 2004). A
pretty good “how-to” for sounds. Explains formats, something about
how to create, etc.
Books
Jourdain, Robert. Music, the brain, and ecstasy: How music
captures our imagination. New York: William Morrow and Co., Inc., 1997.
Sloboda, John A. The Musical Mind: The cognitive psychology
of music. Oxford: Oxford University Press, 1988.
Van Bergeijk, Willem A., John R. Pierce, Edward E. David,
Jr. Waves and the ear. Garden City, NY: Anchor Books, 1960.
Papers
Bjur, Jona J. 1998. “Auditory icons in an information
space.” play.tii.se/publications/1998/auditory.pdf (7 April 2004). Department
of Industrial Design, School of Design and Craft, Göteborg University.
Bloom, Jonathan. 2001. "Of mice and mouths: usability
issues when combining speech and graphic user interfaces." Proceedings,
Usability Professionals' Association Tenth Annual Conference, 2001. Bloomingdale,
IN: UPA (CD-ROM).
Bussemakers, Myra P., Abraham de Haan. 1998. “Using
earcons and icons in categorisation tasks to improve multimedia interfaces.”
http://www.icad.org/websiteV2.0/Conferences/ ICAD98/papers/BUSSEMAK.PDF (7 April
2004). From the Nijmegen Institute for Cognition and Information, Catholic University
of Nijmegen.
Conversy, Stéphane. 1998. “Wind and wave auditory
icons for monitoring continuous processes.” http://www.lri.fr/~conversy/publications/chi98.pdf (7 April 2004). From Laboratoire de Recherche en Informatique.
Ellis, Dan. 2003. “Scene analysis for speech and audio
recognition.” http://www.ee.columbia.edu/~dpwe/talks/MIT-2003-04.pdf (7
April 2004). From Laboratory for Recognition and Organization of Speech and
Audio (LabROSA), Columbia University, New York.
Lemmens, Paul M.C., Myra P. Bussemakers, Abraham de Haan.
2000. “The effect of earcons on reaction times and error-rates in a dual-task
vs. a single-task experiment.” http://www.icad.org/websiteV2.0/Conferences/ICAD2000/
PDFs/BussemakersDualTask.pdf (7 April 2004). From the Nijmegen Institute for
Cognition and Information, University of Nijmegen.
http://emacspeak.sourceforge.net A powerful audio desktop for leveraging today's evolving semantic WWW. Includes
different theme pages, including two based on the sounds of chimes and cartoons
(http://emacspeak.sourceforge.net/themes.html).
http://groups.yahoo.com/group/uvip/ Yahoo group (E-mail list) for visually impaired people who are interested in
usability, or usability people who are interested in the problems of visually
impaired people trying to use their interfaces.
http://scansoft.com/ This company provides not only dictation software such as Dragon NaturallySpeaking
and IBM ViaVoice, but also embedded speech products such as those used in automobiles
and in network and telecom products.
http://www.inspiredcode.net/ A web site that provides not only some shareware for blind and visually impaired
users. A couple of their shareware utilities are pretty interesting: 4BlindMice
is a mouse-driven screen reader add-on that plays musical tones for X and Y
position as you move the mouse and verbalizes icons as you pass over them, and
Metris is a musical Tetris game.
Ware, Colin. 2000. Information visualization, perception
for design. San Francisco: Morgan Kaufmann Publishers.
Weinman, Lynda. 1996-2003. "The web-safe color dilemma."
Lynda.com: Education by creative professionals. http://www.lynda.com/hex.html (accessed 28 March 2002).
Wilde, Judith, Richard Wilde. 1991. Visual Literacy: A Conceptual
Approach to Graphic Problem Solving. New York: Watson Guptill.
Cognitive Psychology and Multiple Intelligences
Gardner, Howard. 1983. Frames of mind: The theory of multiple
intelligences. New York: Basic Books.
Klein, Gary. 1999. Sources of power: How people make decisions. Cambridge, MA: MIT Press.
LeCompte, Denny C. August 2000. “3.14159, 42, and
7 ± 2: Three numbers that (should) have nothing to do with user interface
design.” Internetworking. 3(2):1–5. http://www.internettg.org/newsletter/aug00/article_miller.html (accessed 3 October 2003).
MacEachren, Alan M. 1995. How maps work: Representation,
visualization, and design. New York: Guilford Publications.
Miller, George. 1956. “The magical number seven, plus
or minus two: Some limits on our capacity for processing information.”
Psychological Review. 63:81–97; also available online at http://www.well.com/user/smalin/miller.html
(accessed 14 November 2002).
Myers, David G. 2002. Intuition: Its powers and perils. New Haven, CT: Yale University Press.
Accessibility
Clark, Joe. 2002. Building accessible websites (with CD-ROM).
Indianapolis, IN: New Riders.
Kuusisto, Stephen. 1998. Planet of the blind: A memoir. New York: Bantam Doubleday Dell Publishing Group, Inc.
Mayer, Tommye-K. 1996. One-handed in a two-handed world:
Your personal guide to managing single-handedly. Boston: Prince-Gallison Press.
Mooney, Jonathan, David Coles. 2000. Learning outside the
lines: Two Ivy League students with learning disabilities and ADHD give you
the tools for academic success and educational revolution. New York: Simon &
Schuster.
Mueller, John Paul. 2003. Accessibility for everybody: Understanding
the Section 508 accessibility requirements. Berkeley, CA: Apress LP.
Nielsen, Jakob. Oct. 1996. “Accessible design for
users with disabilities.” Useit.com Alertbox. http://www.useit.com/alertbox/9610.html (accessed 29 August 2003).
Nielsen, Jakob. June 13, 1999. “Disabled accessibility:
The pragmatic approach.” Useit.com Alertbox. http://www.useit.com/alertbox/990613.html (accessed 29 August 2003).
Nielsen, Jakob. Oct. 14, 2002. “Making Flash usable
for users with disabilities.” Useit.com Alertbox. http://www.useit.com/alertbox/20021014.html (accessed 26 October 2002).
Nielsen, Jakob. Nov. 11, 2002. “Beyond accessibility:
Treating users with disabilities as people.” Useit.com Alertbox. http://www.useit.com/alertbox/20011111.html (accessed 29 August 2003).
Paciello, Michael G. 2000. Web accessibility for people
with disabilities. Lawrence, KS: CMP Media, Inc.
Ray, Deborah S., Eric J. Ray. “Adaptive technologies
for the visually impaired: The role of technical communicators.” Technical
Communication. 45(4):573-579.
Sacks, Oliver. 1984. A leg to stand on. New York: Harper
& Row Publishers.
Sacks, Oliver. 2000. Seeing voices: A journey into the world
of the deaf. New York: Vintage Books.
Sacks, Oliver. July 28, 2003. “A neurologist’s
notebook; The mind’s eye: What the blind see.” New Yorker. Pp. 48–59.
Bob Stein’s Visibone, “Color-deficient vision,
simulation in the web designer's color card and chart” and links to other
information about color confusions: http://www.visibone.com/colorblind/.
World Wide Web Consortium’s “Techniques for
accessibility evaluation and repair tools,” which includes an algorithm
for testing color contrast: http://www.w3.org/TR/AERT#color-contrast.
Chadwick-Dias, Ann. 1st Quarter, 2002. “How age affects
user performance on the Web.” Usable Bits. http://hid.fidelity.com/q22002/age.htm (accessed 28 October 2003).
ERwin Data Modeler from Computer Associates. “AllFusion
ERwin Data Modeler is a powerful database development tool, automatically generating
tables and thousands of lines of stored procedure and trigger code for leading
databases.” See http://www3.ca.com/ (accessed 7 May 2003) for more information.
Oracle Designer from Oracle. “Oracle9i JDeveloper
lets J2EE developers take advantage of UML modeling directly from their integrated
development environment…. Oracle9i Designer models business processes,
data entities and relationships. Models are transformed into designs from which
complete applications and databases are generated.” See http://www.oracle.com/ (accessed 7 May 2003) for more information.
Rational Rose Professional Data Modeler from IBM. “In
the past, data modelers have used ER notation to describe the database and data
access, while developers and business analysts use the Unified Modeling Language
(UML), the standard notation for software architecture, for design and use case
modeling. By integrating the modeling environment with the database design environment,
Rose Professional Data Modeler maps the object and data models, tracking changes
across business, application and data models.” See http://www.rational.com/ (accessed 7 May 2003) for more information.
LizardTech’s GeoExpress compression and encoding methods
for creating fast-loading maps and map mosaics (also now part of the ESRI ArcGIS
Desktop): http://www.lizardtech.com/solutions/geospatial/
University of Maryland Human Computer Interaction Laboratory,
highly interactive filtering and selection software for visualizations, including
maps: http://www.cs.umd.edu/hcil/census/
U.S. Army Topographic Engineering Center, Geospatial Applications
Branch, Engineer Research and Development Center, Corpscon version 5.11.08—converts
coordinates between geographic, state plane and Universal Transverse Mercator
(UTM) systems on the North American Datum of 1927 (NAD 27), the North American
Datum of 1983 (NAD 83), and High Accuracy Reference Networks (HARNs); also vertical
conversions to and from the National Geodetic Vertical Datum of 1929 (NGVD 29)
and the North American Vertical Datum of 1988 (NAVD 88). http://crunch.tec.army.mil/software/corpscon/corpscon.html
ViewPlus Technologies (accessible maps, graphs, and technical
diagrams using SVG, Tiger embossing printers): http://www.viewplustech.com/
Authors
Alice Preston
Aluka User Services
100 Campus Drive, Suite 100
Princeton, NJ 08540
USA
Susan Fowler
FAST Consulting
134 Franklin Ave.
Staten Island, NY 10301
USA
Your Comments and Questions
Please write to us and we'll add your comments to this page.